


Trusted by over 15 Million Traders
The Most Awarded Broker
for a Reason
Easy Access to 1,400+ Global Assets
EURUSD
Euro vs U.S. Dollar
US500
S&P 500 (US500)
GOLD
Gold
COFFEE
US Coffee
Apple
Apple (AAPL.OQ)
-

Finance Magnates 颁发
-

Finance Magnates 颁发
-

Capital Finance International Magazine (CFI.co) 2024年颁赠
-

COLWMA 2024年颁赠
-

荣获World Finance Forex Awards 2023最佳外汇客户服务奖
-

荣获World Finance Forex Awards 2023欧洲最佳外汇经纪商奖
-

荣获World Finance Forex Awards 2023澳大拉西亚最佳外汇经纪商奖
-

荣获World Finance Forex Awards 2023拉丁美洲最佳外汇经纪商奖
-

荣获World Finance Forex Awards 2023中东最佳外汇经纪商奖
-

CFI.co于2023年颁赠
-

荣获2023年City of London Wealth Management Awards
-

荣获2022年埃及金融博览会颁赠
-

荣获2022年City of London Wealth Management Awards
-

CFI.co于2022年颁赠
-

荣获Global Forex Awards 2022 — 零售外汇 颁赠
-
2021年迪拜外汇博览会获颁赠
-

Ultimate Fintech 2021年颁赠
-

荣获2021年City of London Wealth Management Awards
-

FX168于2020年12月颁赠
-

荣获Global Business Awards 2020
-

荣获2020年City of London Wealth Management Awards
-

Capital Finance International Magazine (CFI.co)颁赠
-

Capital Finance International Magazine (CFI.co)颁赠
-

荣获2019年City of London Wealth Management Awards
-

Shares Magazine 授予 UK Forex Awards 2018
-

Capital Finance International Magazine (CFI.co)颁赠
-

Capital Finance International Magazine (CFI.co)颁赠
-

2017年伦敦财富管理奖
-

2016最佳本土 客户服务
-

中东和北非地区(MENA)增长最快的经纪商
-
2015年最佳外汇科技提供商
-
2014年最佳外汇科技提供商
-

2014年最佳外汇科技提供商
-

荣获 The Trading Show 2024年非洲 Africa Fintech 峰会颁赠
-

荣获2024年中东地区 Brokersview 颁赠
-
荣获2024年中东地区 Brokersview 颁赠
-

荣获2024年阿曼 Smart Vision 峰会颁赠
-

荣获2024年迪拜外汇博览会颁赠
-

荣获2024年迪拜 Forex Traders Summit 颁赠
-

2024年埃及 Smart Vision 峰会颁赠
-

投查查于2024年颁赠
-

Capital Finance International Magazine (CFI.co) 2024年颁赠
-

CFI.co于2023年颁赠
-

CFI.co于2023年颁赠
-

交易社区平台FOLLOWME于2022年颁赠
-
2022年迪拜Forex Expo获颁赠
-
2022年迪拜Forex Expo获颁赠
-

荣获Global Forex Awards 2022 — 零售外汇 颁赠
-

CFI.co于2022年颁赠
-

CFI.co于2022年颁赠
-

World Finance Forex Awards 2022 颁发
-

World Finance Forex Awards 2022 颁发
-

World Finance Forex Awards 2022 颁发
-

World Finance Forex Awards 2022 颁发
-
交易社区平台FOLLOWME于2021年颁赠
-

2021年埃及Smart Vision Investment Expo博览会获颁赠
-

CFI.co于2021年颁赠
-

CFI.co于2021年颁赠
-

荣获Global Forex Awards 2021 — 零售外汇 颁赠
-

荣获Global Forex Awards 2021 — 零售外汇 颁赠
-

World Finance 2021颁发
-

World Finance 2021颁发
-
FOLLOWME于2021年颁赠
-

Global Forex Awards 2021 — B2B 颁赠
-

Global Forex Awards颁赠
-

Global Forex Awards颁赠
-

CFI.co于2020年颁赠
-

CFI.co于2020年颁赠
-

荣获Global Business Awards 2020
-

World Finance Magazine 颁赠
World Finance Forex Awards 2020 -

World Finance Magazine 颁赠
World Finance Forex Awards 2020 -
FOLLOWME交易社区授予
-

Global Forex Awards颁赠
-

Global Forex Awards颁赠
-

FinTech Age Awards颁发
-

World Finance Magazine 颁赠
World Finance Forex Awards 2019 -

World Finance Magazine 颁赠
World Finance Forex Awards 2019 -

荣获 World Finance Forex Awards 2018 颁赠
-

荣获2018年埃及金融博览会颁赠
-

荣获 Shares Magazine 的 UK Forex Awards 2017 颁赠
-

荣获 World Finance Forex Awards 2017
-

2016年最佳黄金经纪商
-

2016年最佳外汇经纪商
-

2015年最佳本地客户服务
-

Global Brands Magazine 颁赠
-

Online Money Awards 2022 颁发
-

荣获2022年埃及金融博览会颁赠
-

2015最佳外汇交易平台
-

2015最佳金融交易平台
-

2013最佳创新外汇平台奖
-

2020年 Cyprus HR Awards 颁赠
-

金融行业的佼佼者
-

认证最优金牌级别
-

2014年首届亚军
-
Finance Magnates 颁发
-
Finance Magnates 颁发
-
Capital Finance International Magazine (CFI.co) 2024年颁赠
-
COLWMA 2024年颁赠
-
荣获World Finance Forex Awards 2023最佳外汇客户服务奖
-
荣获World Finance Forex Awards 2023欧洲最佳外汇经纪商奖
-
荣获World Finance Forex Awards 2023澳大拉西亚最佳外汇经纪商奖
-
荣获World Finance Forex Awards 2023拉丁美洲最佳外汇经纪商奖
-
荣获World Finance Forex Awards 2023中东最佳外汇经纪商奖
-
CFI.co于2023年颁赠
-
荣获2023年City of London Wealth Management Awards
-
荣获2022年埃及金融博览会颁赠
-
荣获2022年City of London Wealth Management Awards
-
CFI.co于2022年颁赠
-
荣获Global Forex Awards 2022 — 零售外汇 颁赠
-
2021年迪拜外汇博览会获颁赠
-
Ultimate Fintech 2021年颁赠
-
荣获2021年City of London Wealth Management Awards
-
FX168于2020年12月颁赠
-
荣获Global Business Awards 2020
-
荣获2020年City of London Wealth Management Awards
-
Capital Finance International Magazine (CFI.co)颁赠
-
Capital Finance International Magazine (CFI.co)颁赠
-
荣获2019年City of London Wealth Management Awards
-
Shares Magazine 授予 UK Forex Awards 2018
-
Capital Finance International Magazine (CFI.co)颁赠
-
Capital Finance International Magazine (CFI.co)颁赠
-
2017年伦敦财富管理奖
-
2016最佳本土 客户服务
-
中东和北非地区(MENA)增长最快的经纪商
-
2015年最佳外汇科技提供商
-
2014年最佳外汇科技提供商
-
2014年最佳外汇科技提供商
-
荣获 The Trading Show 2024年非洲 Africa Fintech 峰会颁赠
-
荣获2024年中东地区 Brokersview 颁赠
-
荣获2024年中东地区 Brokersview 颁赠
-
荣获2024年阿曼 Smart Vision 峰会颁赠
-
荣获2024年迪拜外汇博览会颁赠
-
荣获2024年迪拜 Forex Traders Summit 颁赠
-
2024年埃及 Smart Vision 峰会颁赠
-
投查查于2024年颁赠
-
Capital Finance International Magazine (CFI.co) 2024年颁赠
-
CFI.co于2023年颁赠
-
CFI.co于2023年颁赠
-
交易社区平台FOLLOWME于2022年颁赠
-
2022年迪拜Forex Expo获颁赠
-
2022年迪拜Forex Expo获颁赠
-
荣获Global Forex Awards 2022 — 零售外汇 颁赠
-
CFI.co于2022年颁赠
-
CFI.co于2022年颁赠
-
World Finance Forex Awards 2022 颁发
-
World Finance Forex Awards 2022 颁发
-
World Finance Forex Awards 2022 颁发
-
World Finance Forex Awards 2022 颁发
-
交易社区平台FOLLOWME于2021年颁赠
-
2021年埃及Smart Vision Investment Expo博览会获颁赠
-
CFI.co于2021年颁赠
-
CFI.co于2021年颁赠
-
荣获Global Forex Awards 2021 — 零售外汇 颁赠
-
荣获Global Forex Awards 2021 — 零售外汇 颁赠
-
World Finance 2021颁发
-
World Finance 2021颁发
-
FOLLOWME于2021年颁赠
-
Global Forex Awards 2021 — B2B 颁赠
-
Global Forex Awards颁赠
-
Global Forex Awards颁赠
-
CFI.co于2020年颁赠
-
CFI.co于2020年颁赠
-
荣获Global Business Awards 2020
-
World Finance Magazine 颁赠
World Finance Forex Awards 2020 -
World Finance Magazine 颁赠
World Finance Forex Awards 2020 -
FOLLOWME交易社区授予
-
Global Forex Awards颁赠
-
Global Forex Awards颁赠
-
FinTech Age Awards颁发
-
World Finance Magazine 颁赠
World Finance Forex Awards 2019 -
World Finance Magazine 颁赠
World Finance Forex Awards 2019 -
荣获 World Finance Forex Awards 2018 颁赠
-
荣获2018年埃及金融博览会颁赠
-
荣获 Shares Magazine 的 UK Forex Awards 2017 颁赠
-
荣获 World Finance Forex Awards 2017
-
2016年最佳黄金经纪商
-
2016年最佳外汇经纪商
-
2015年最佳本地客户服务
-
Global Brands Magazine 颁赠
-
Online Money Awards 2022 颁发
-
荣获2022年埃及金融博览会颁赠
-
2015最佳外汇交易平台
-
2015最佳金融交易平台
-
2013最佳创新外汇平台奖
-
2020年 Cyprus HR Awards 颁赠
-
金融行业的佼佼者
-
认证最优金牌级别
-
2014年首届亚军

Awarded BestBrokerYear After Year
CATEGORIES
News
- Dollar falls against yen during Trump's visit to Japan
- Can gold still reach 4300?
- The price of silver fell back to $51.90. After being overbought for a short peri
- A collection of good and bad news affecting the foreign exchange market
- The U.S. dollar index is close to the pressure range, continue to pay attention
market analysis
Gold is still hovering around the daily short-term moving average, pulling back and forth, pay attention to range fluctuations, ;;
Wonderful introduction:
You don’t have to learn to be sad in your youth. What www.xmserving.comes and goes is not worth the time. What I promised you, maybe it shouldn’t be a waste of time. Remember, the icy blue that stayed awake all night, is like the romance swallowed by purple jasmine, but the road is far away and the person has not returned. Where does the love stop?
Hello everyone, today XM Forex will bring you "[XM Foreign Exchange Market Analysis]: Gold is still hovering at the daily short-term moving average and pulling back and forth, pay attention to range fluctuations, ;;". Hope this helps you! The original content is as follows:
Zheng’s point of view: Gold is still hovering at the daily short-term moving average, pulling back and forth, pay attention to range fluctuations
Reviewing yesterday’s market trends and emerging technical points:
First, gold: it fell sharply early yesterday, and as a shock trend, the continuity in the morning is poor, so if you pull down first, you can wait for the bullish rebound to stabilize, 3945-3915 After the 618 division position 3965 that was pushed back in the previous wave stabilized K, a big sun soared directly, broke through the hourly mid-rail, then stepped back to the mid-rail to follow a wave of rebound, and finally reached the target of 4020 and above; the U.S. market repeatedly relied on the mid-rail to fluctuate bullishly, the first time 4008 was touched but did not make a decisive move, reaching 4020; the second time it stepped back to 4010 to see the bullish trend, but unfortunately pierced 4000; the night prompt was that 3995 was up The support did rebound to 4015;
Second, for silver: the white market first moved upward around the lower rail support of the short-term upward channel, 48.4, and reached 48.85, reaching a maximum of 49; It used to be below the 10th and above the 5th, and the outcome is undecided, and the www.xmserving.competition continues today; the 5-day moving average has turned slightly upward, indicating that the support has strengthened; while the 10-day moving average continues to press down to 4022, and there is no sign of flattening, which also indicates that the pressure is high; although the 5-day moving average has been pierced in the past two days, the closing line is still above the 5th in late trading, and has not weakened effectively; this continued sideways is a good thing for bulls, and can gradually decreaseThe low corresponds to the wave peak of macd, so when it is close to the zero axis or crosses below the zero axis, it will gradually brew a golden cross and exert a wave of upward trend; before the 10 moving average has not effectively broken through, it is not ruled out that it may suppress downwards for another wave to stabilize;
Second, gold 4 Hourly level: The negative line fell at the opening today and fell below the middle rail. At this time, the middle rail and the 10 moving average resonated and were under pressure at the 4000 line. Only by closing above it can we continue to test the highs of the previous two days of 4020-4030; otherwise, the operation is suppressed below 4000;
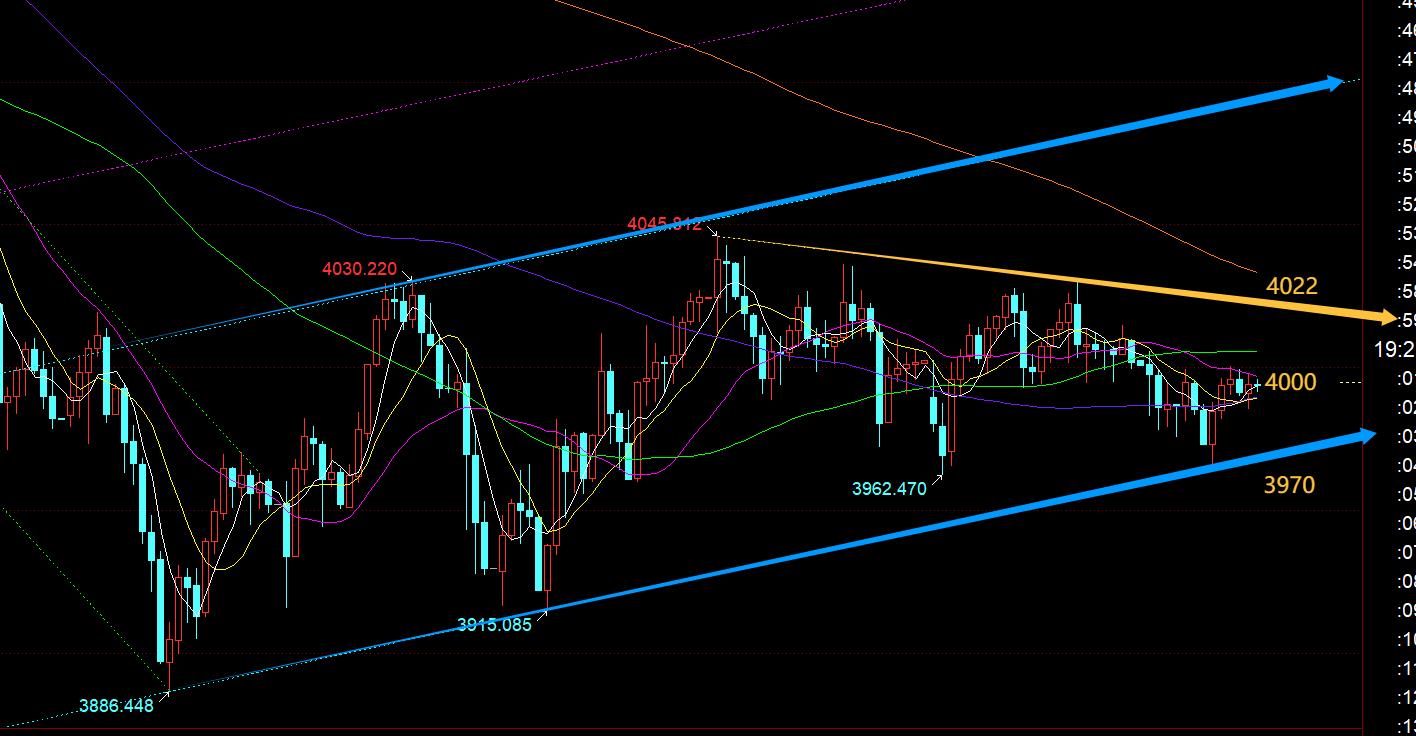
Third, the golden hour line level: There was another cycle of decline this morning. When there is a sign of bottoming out and a long lower shadow K at 11 o'clock, it reminds 3980 that it can first see a wave of rebound to repair the increase. It should fall or pull first in the morning. In the volatile market, the continuity is the worst. Generally, you can choose the opportunity to seize a wave of reverse around 11 o'clock (winter time). , finally successfully reached the 4000 line; in the afternoon, the 10 moving average fell under pressure again, and the above chart corresponded to the lower rail of the blue channel. The derived support point 3967 stabilized and bullish rebounded, and finally hit the lowest point, and another wave of rise reached the 4000 mark; tonight, the lower rail of 3997 is the key to a central axis, or 4000 The line is the key. Once it breaks through and closes above, you can step back and confirm that you can continue to see a wave of rebound to test the yellow trend resistance point 4020-22. If the pressure here cannot be reached, it will rise higher and fall back; on the contrary, if the middle track or below 4000 has been unable to bear the pressure, it will continue to fall to test the low. At that time, pay attention to 3674-70 to stabilize and rebound; in addition, if If the downwards effectively break the lower track of the blue channel, you should be careful of another wave of weakening and suppressing, and move into a downward flag shape. At that time, the time node for the daily secondary high will have to be postponed; on the contrary, if it breaks through the yellow trend resistance line upward, it is expected to gradually rebound to test the upper rail of the blue channel, which will speed up the time node for the daily secondary high point;
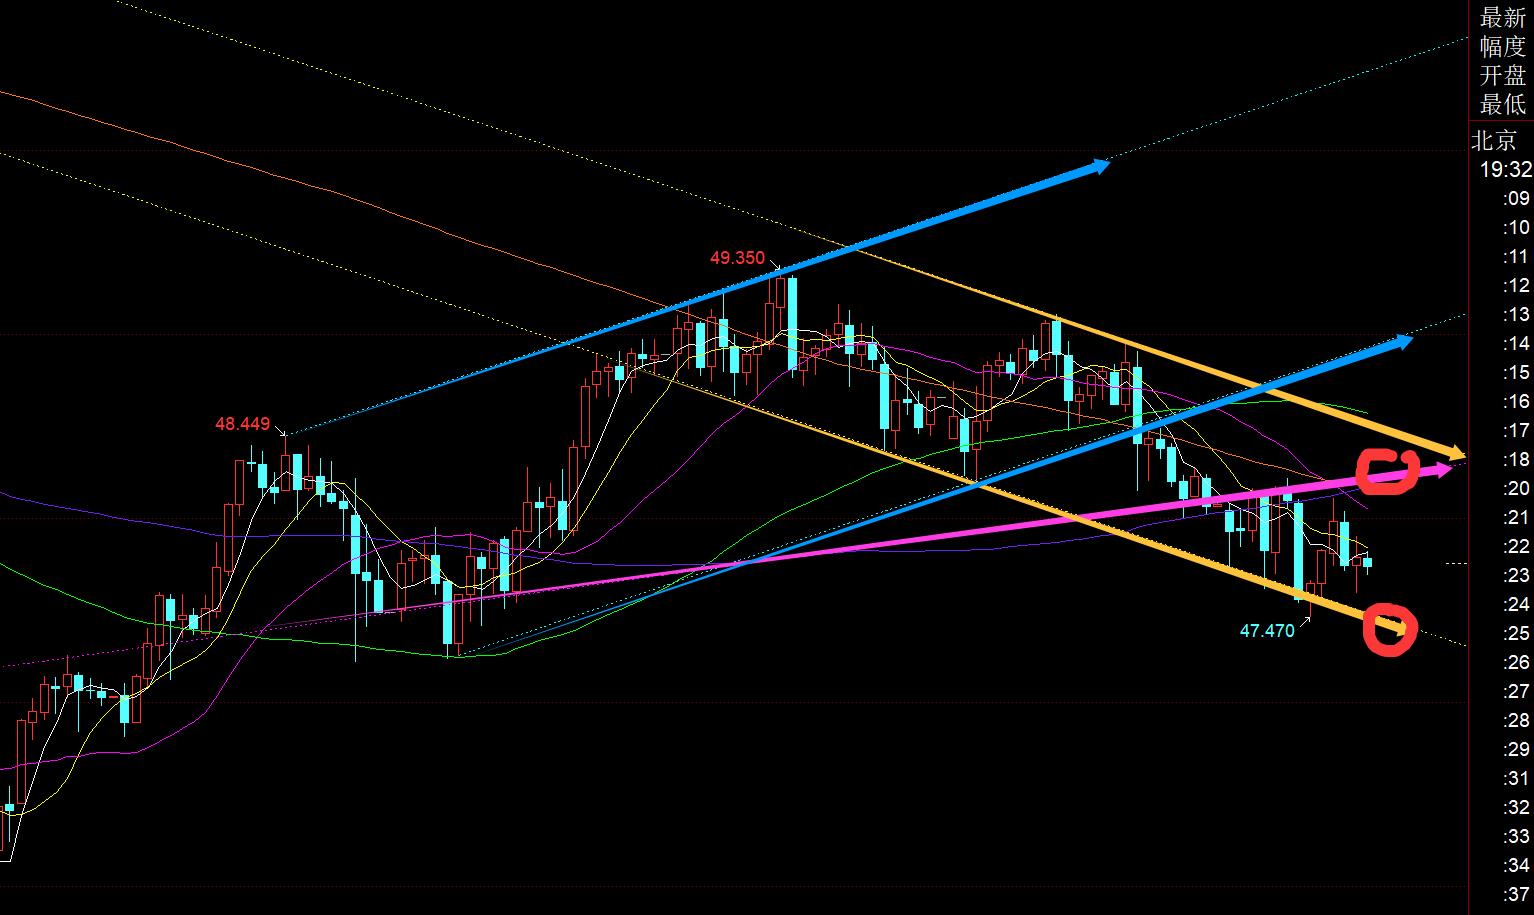
Silver: The current daily line on the 5th is a golden cross on the 10th, and the 5th moving average turns upward, but the price is always running below the moving average, which means there is some possibility of price deviation. Beware of a sudden oversold rebound at some point in the day and a return to close above the 5th day; of course, if it cannot return to the upward trend and continues to close the negative line, tomorrow may also cause the 5th moving average to turn downward and www.xmserving.come under pressure, in which case it is necessary to repair last week's positive streak. The rebound growth rate; the weekly 10-day support moved up to 46.7, and the daily support for the upper rail confirmation point of the early upward channel moved up to 46.3, so the range of 46.7-46.3 this week is a relatively strong support level; judging from the channel distribution in the upper chart during the day, the original blue upward channel has been broken down, and it is currently on a yellow downward channel. After the support of the purple trend line that had been unilaterally raised in September fell, today it rebounded multiple times to test the 48.15 lineIt has become a key counter-pressure point today, and the Asian and European markets have repeatedly touched the lower rail support of the yellow channel and repeatedly pulled up and fluctuated; the overall trend is not very clean and relatively bumpy; tonight, pay attention to the first-line support of 47.4, the resistance of 48-48.2, 48.45, and treat it within the range;
Crude oil: short The line is about to weaken again and be suppressed. Pay attention to the 59.6 support. Once it falls, it will continue a downward trend;
The above are several views of the author's technical analysis. As a reference, it is also a summary of the technical experience accumulated by monitoring and reviewing the market for more than 12 hours a day for 12 years. Technical points will be disclosed every day, and the configuration will be www.xmserving.combining text and video interpretation, friends who want to learn can www.xmserving.compare and refer to the actual trend; those who agree with the idea can refer to the operation, take good defense, and risk control first; those who do not agree can just ignore it; thank you all for your support and attention;
[The opinions of the article are for reference only, investment is risky, and you need to be cautious when entering the market Be cautious, operate rationally, strictly set losses, control positions, risk control first, be responsible for profits and losses]
Writer: Zheng Shi Dian Yin
Read and study the market for more than 12 hours a day, insist on ten years, detailed technical interpretations are made public on the entire network, and serve with sincerity, dedication, sincerity, perseverance, and wholehearted service to the end! Write www.xmserving.comments on major financial websites! Proficient in K-line rules, channel rules, time rules, moving average rules, segmentation rules, and top-bottom rules; student cooperation registration hotline - WeChat: zdf289984986
The above content is about "[XM Foreign Exchange Market Analysis]: Gold is still hovering at the daily short-term moving average and pulling back and forth, pay attention to interval shocks, ;;". It is carefully www.xmserving.compiled and edited by the XM Foreign Exchange editor. I hope it will be helpful to your trading! Thanks for the support!
Only the strong know how to fight; the weak are not even qualified to fail, but are born to be conquered. Hurry up and study the next content!
Disclaimers: XM Group only provides execution services and access permissions for online trading platforms, and allows individuals to view and/or use the website or the content provided on the website, but has no intention of making any changes or extensions, nor will it change or extend its services and access permissions. All access and usage permissions will be subject to the following terms and conditions: (i) Terms and conditions; (ii) Risk warning; And (iii) a complete disclaimer. Please note that all information provided on the website is for general informational purposes only. In addition, the content of all XM online trading platforms does not constitute, and cannot be used for any unauthorized financial market trading invitations and/or invitations. Financial market transactions pose significant risks to your investment capital.
All materials published on online trading platforms are only intended for educational/informational purposes and do not include or should be considered for financial, investment tax, or trading related consulting and advice, or transaction price records, or any financial product or non invitation related trading offers or invitations.
All content provided by XM and third-party suppliers on this website, including opinions, news, research, analysis, prices, other information, and third-party website links, remains unchanged and is provided as general market commentary rather than investment advice. All materials published on online trading platforms are only for educational/informational purposes and do not include or should be considered as applicable to financial, investment tax, or trading related advice and recommendations, or transaction price records, or any financial product or non invitation related financial offers or invitations. Please ensure that you have read and fully understood the information on XM's non independent investment research tips and risk warnings. For more details, please click here